Introducing the new Goliath Topology View for Citrix Monitoring and Troubleshooting
Citrix, citrix monitoring, Goliath Technologies, XenApp, XenDesktop
This is an introduction to the all new Goliath Topology View for Citrix Monitoring and Troubleshooting from Goliath Technologies
Overview
Troubleshoot From 50,000FT View to Individual User in 3 Clicks
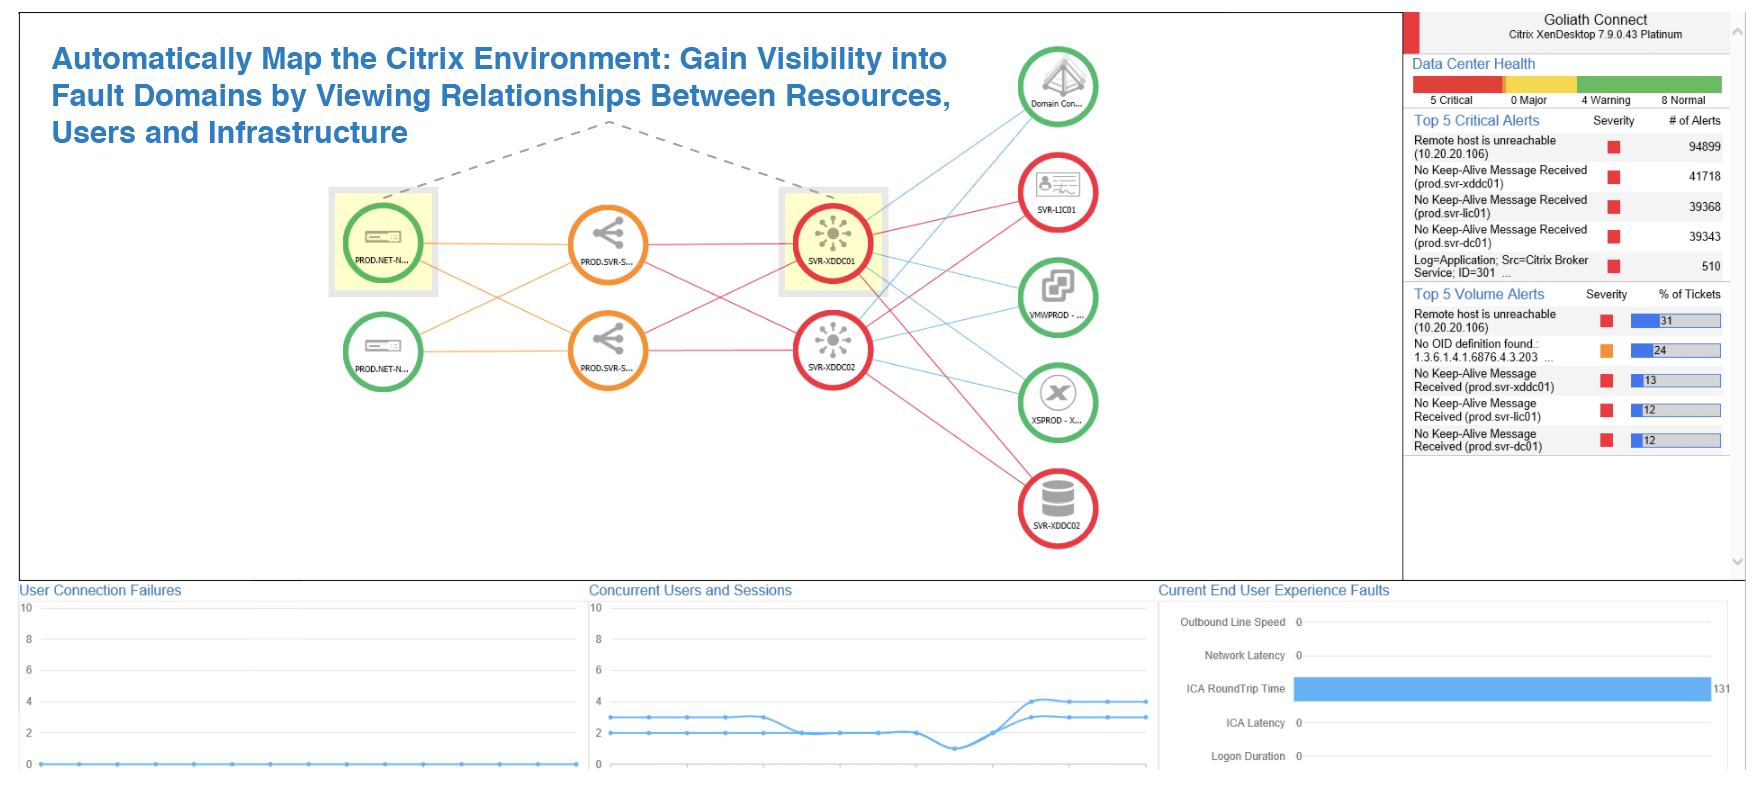
The New Topology View for Citrix Monitoring and Citrix Troubleshooting gives an IT administrator an industry first capability to view their entire global IT infrastructure from a single pane of glass. The admin will receive alert notifications and warnings from the view to understand the physical and relational dynamic between the IT elements emitting the alerts. Then, the administrator can drill into additional layers of the Citrix IT stack down to the individual Citrix user session.
Relational View of IT Element Health and Impact on End User Experience
The new Goliath Topology View for Citrix Monitoring and Troubleshooting adds additional layers of visibility into the Citrix Delivery Infrastructure. The Topology View enables quick and easy identification of performance issues, allowing troubleshooting to start from a dynamic high-level view. These new capabilities give administrators the ability to understand the health of their Citrix XenApp or Citrix XenDesktop infrastructure end-to-end, and how the health of each of those components impact each other, and ultimately the end user.
Topology View Features and Benefits
| Feature | Benefit |
| Troubleshoot infrastructure dependencies such as Active Directory, Microsoft SQL and the virtual infrastructure | XenApp and XenDesktop is highly dependent on several components and services including Active Directory, Microsoft SQL and the virtual infrastructure. The state of these components will impact the overall health of the environment, and ultimately user experience. Topology View allows you to find root cause by showing the relationships that these components have to the delivery infrastructure, and how their status impacts user experience. |
| Automated setup and configuration | Topology view does not require manual intervention to populate the architecture map or to add metrics. The setup process is automated via API integration. |
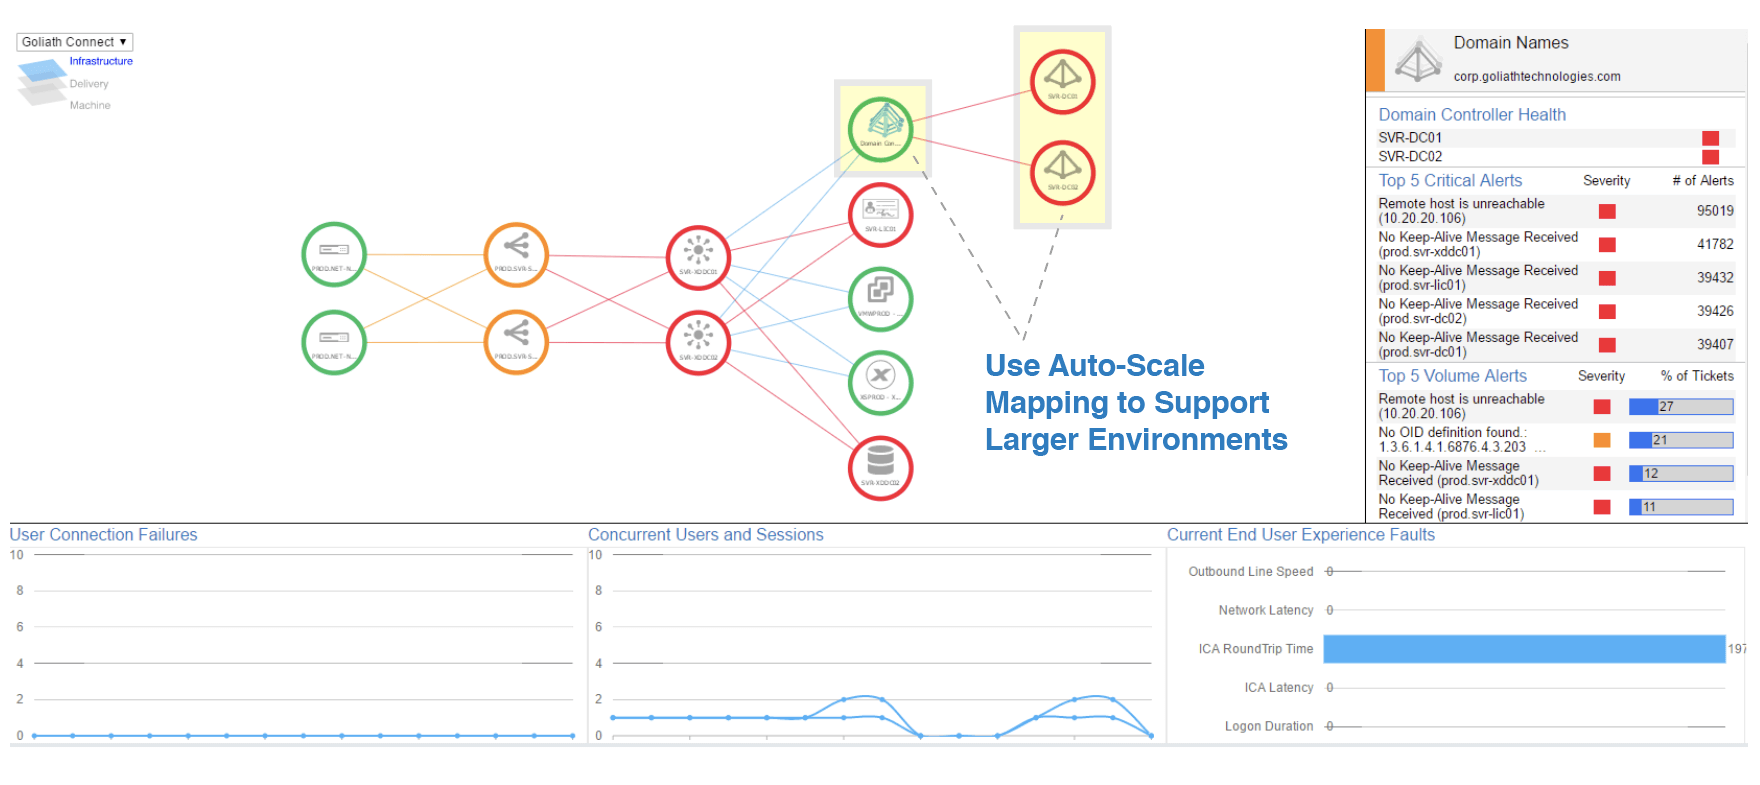
| Auto-scale mapping supports any size deployment | Auto-scale mapping enables the topology view to be adaptive, and readable. Every component of the infrastructure end-to-end is viewable for any size environment. |
| Visibility into component relationships | Citrix deployments are complex and require interoperation between many systems. Having a view into the health of the connections provides insight into how issues with one component will impact another. Understanding relationships is also a key component for troubleshooting end user experience issues derived form system level failures. |
| Graphically Track End User Experience and Resource Consumption | Beyond faults and errors, being aware of resource consumption and user experience health is critical to understanding the overall state of the delivery infrastructure. Topology view graphically presents usage, resource consumption and the user experience to better understand how they impact the health of the environment. |
| Troubleshooting drilldown from physical infrastructure components into logical delivery components for root cause analysis | The health of logical components such as Delivery Groups and Machine Catalogs greatly impact user experience. Topology view provides insight into the state of these components allowing administrators to troubleshoot and correlate infrastructure and logical element issues back to end user experience. |
| Instant visibility of usage statistics, errors, faults, and end user experience issues | Topology view is not simply a map of the environment. It is a fully operational, dynamic monitoring and troubleshooting tool that reflects alerts, faults and issues in real-time. This allows administrators to know the global impact of component related conditions as they happen in real-time. |
The following sections detail each level of the topology view and the data points that they provide. This let´s you quick and easy do Citrix Monitoring and troubleshooting.
Citrix Delivery Infrastructure View
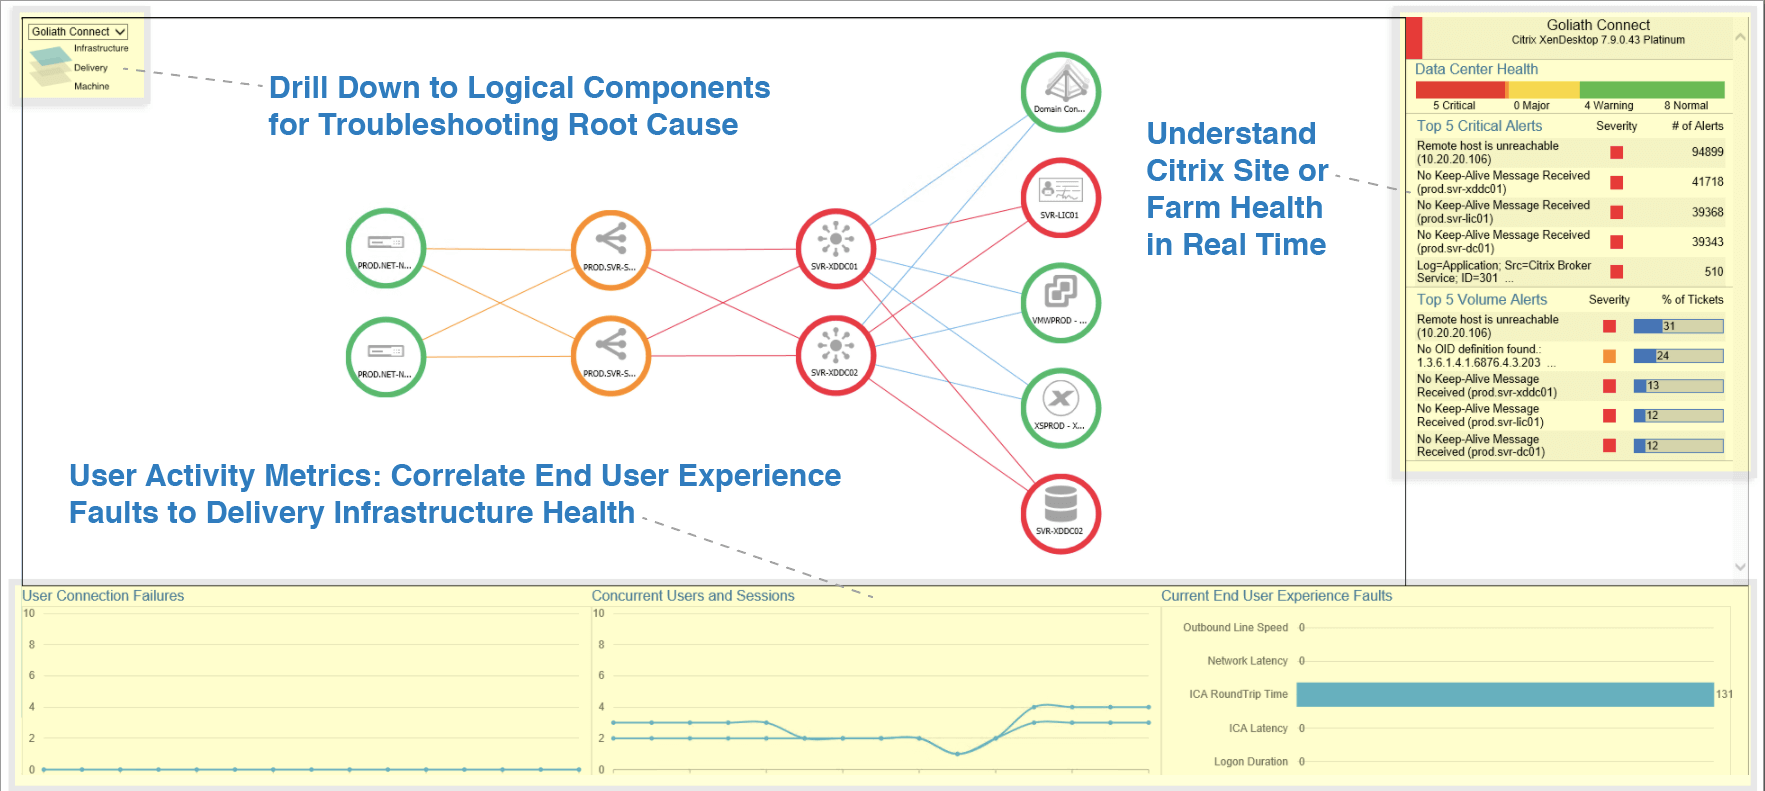
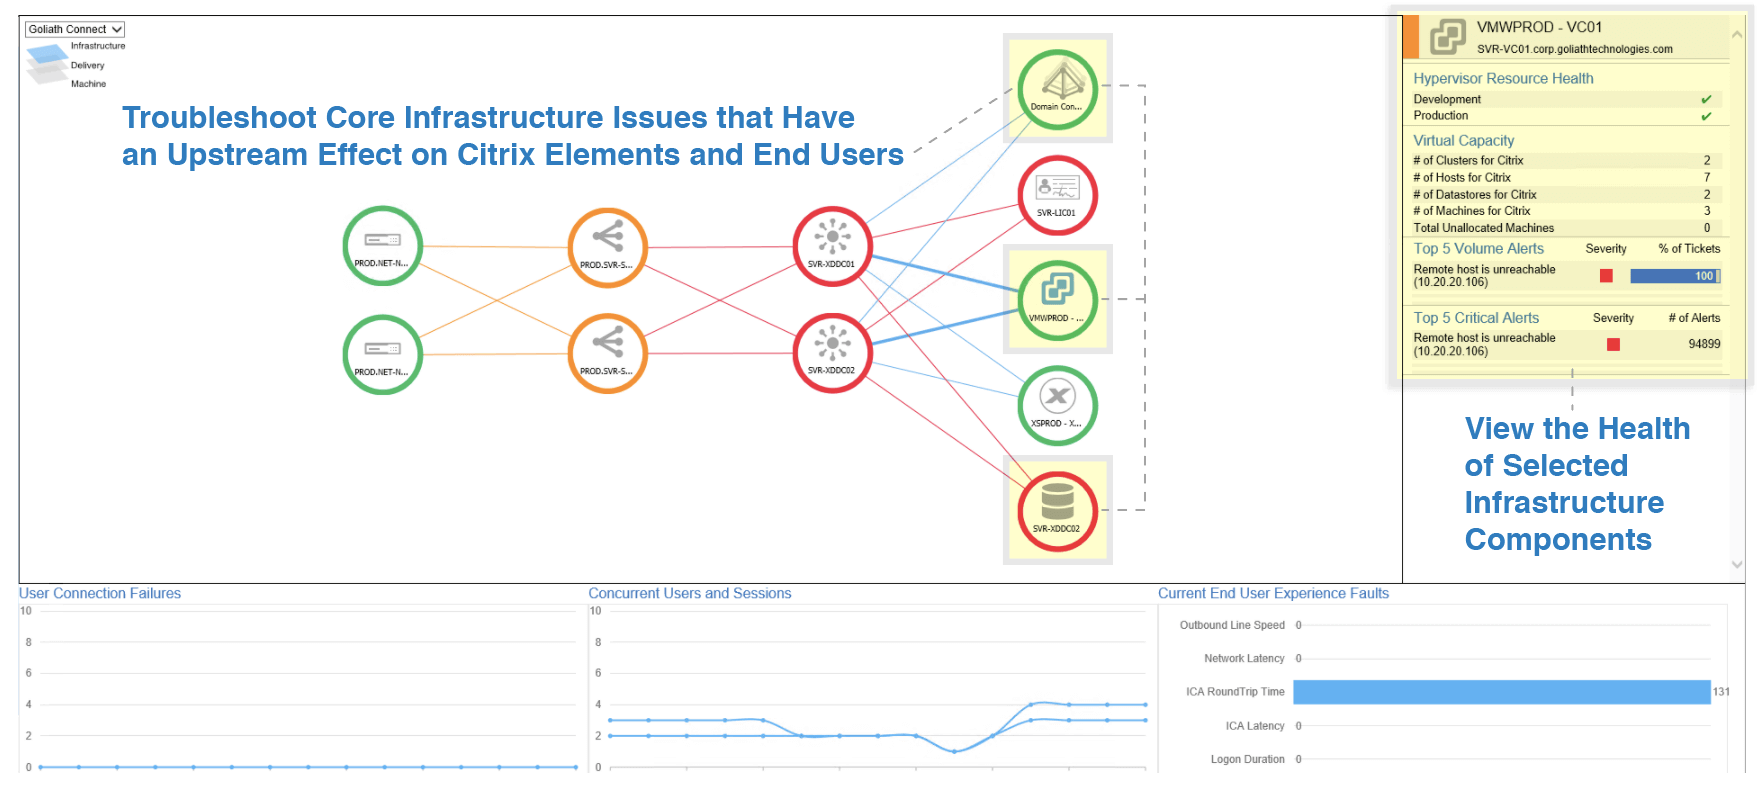
The infrastructure view below is the default, top-level perspective that displays the overall physical topology of the Citrix delivery infrastructure components. It also dynamically shows their relationships to each other, as depicted in the following image. When threshold based alerts are triggered, you know at first glance the IT element responsible for the alert and its relation to other elements in the Citrix delivery infrastructure. The drilldown icons at the top left of the infrastructure map allow you to troubleshoot lower level logical components such as the delivery groups and machine catalogs. The default view provides several key details on the right and lower panes. Utilization metrics and alerts are displayed on the right. The metrics on the bottom display user experience information.
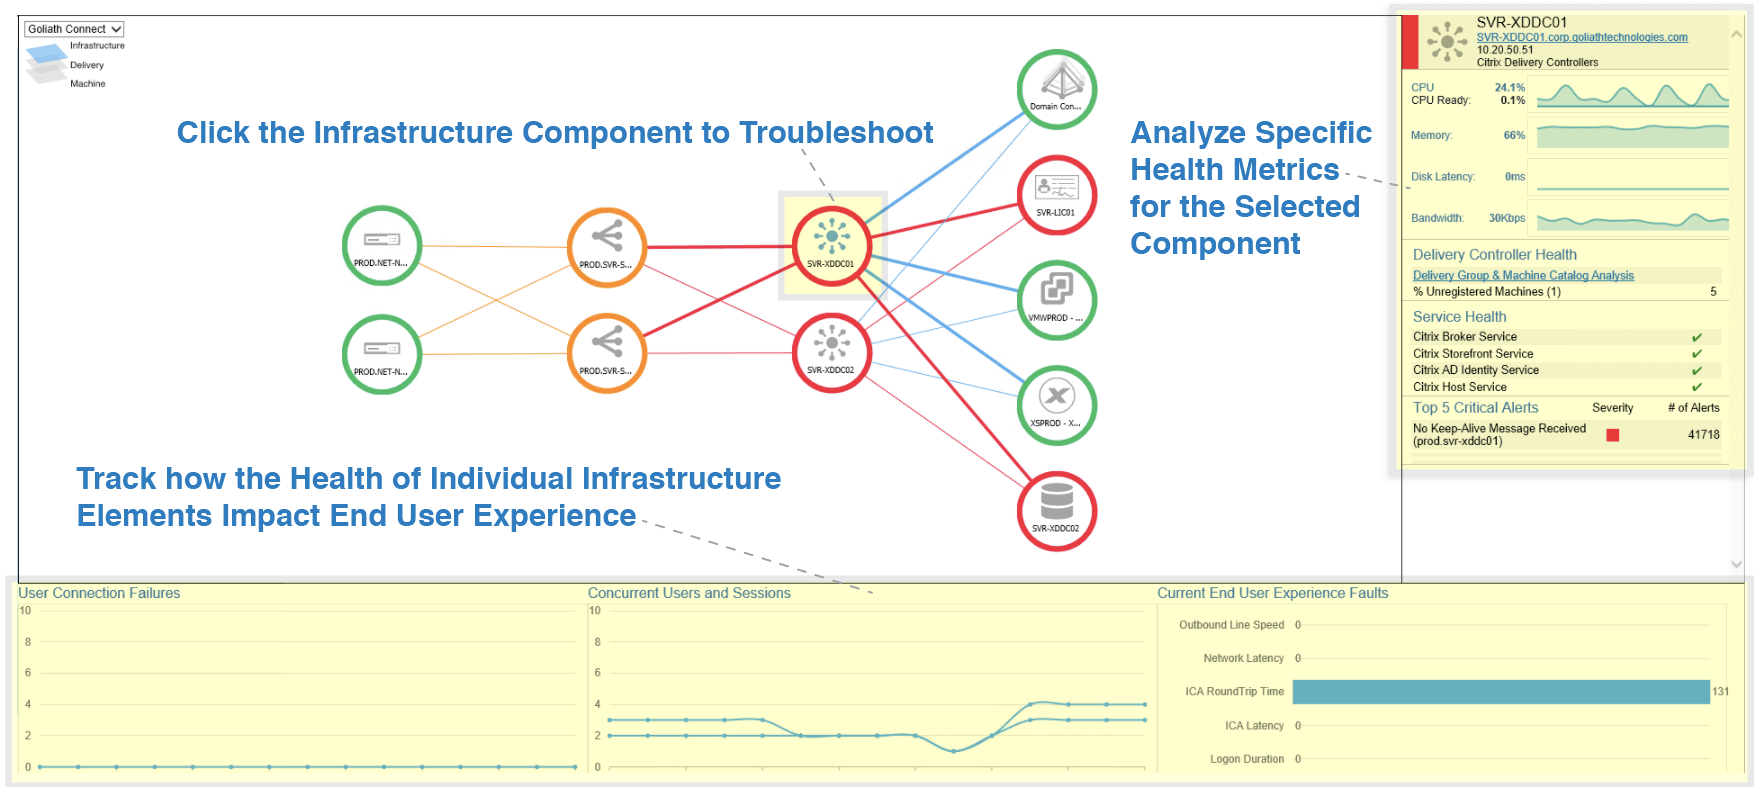
From this high-level view, without leaving the screen, you can select any component from the screen and drill into the details as depicted below to find specific Citrix Monitoring options and views. The metrics on the right change to display information applicable to the specific component selected.
The right pane presents the following data points per component.
| · Component Details
· Resource Health
|
· Services Health
· Top 5 Critical Alerts
|
The bottom pane presents user experience metrics as detailed below
| · User Connection Failures
· Concurrent Users · Outbound Line Speed · Logon Duration
|
· Network Latency
· ICA RTT · ICA Latency
|
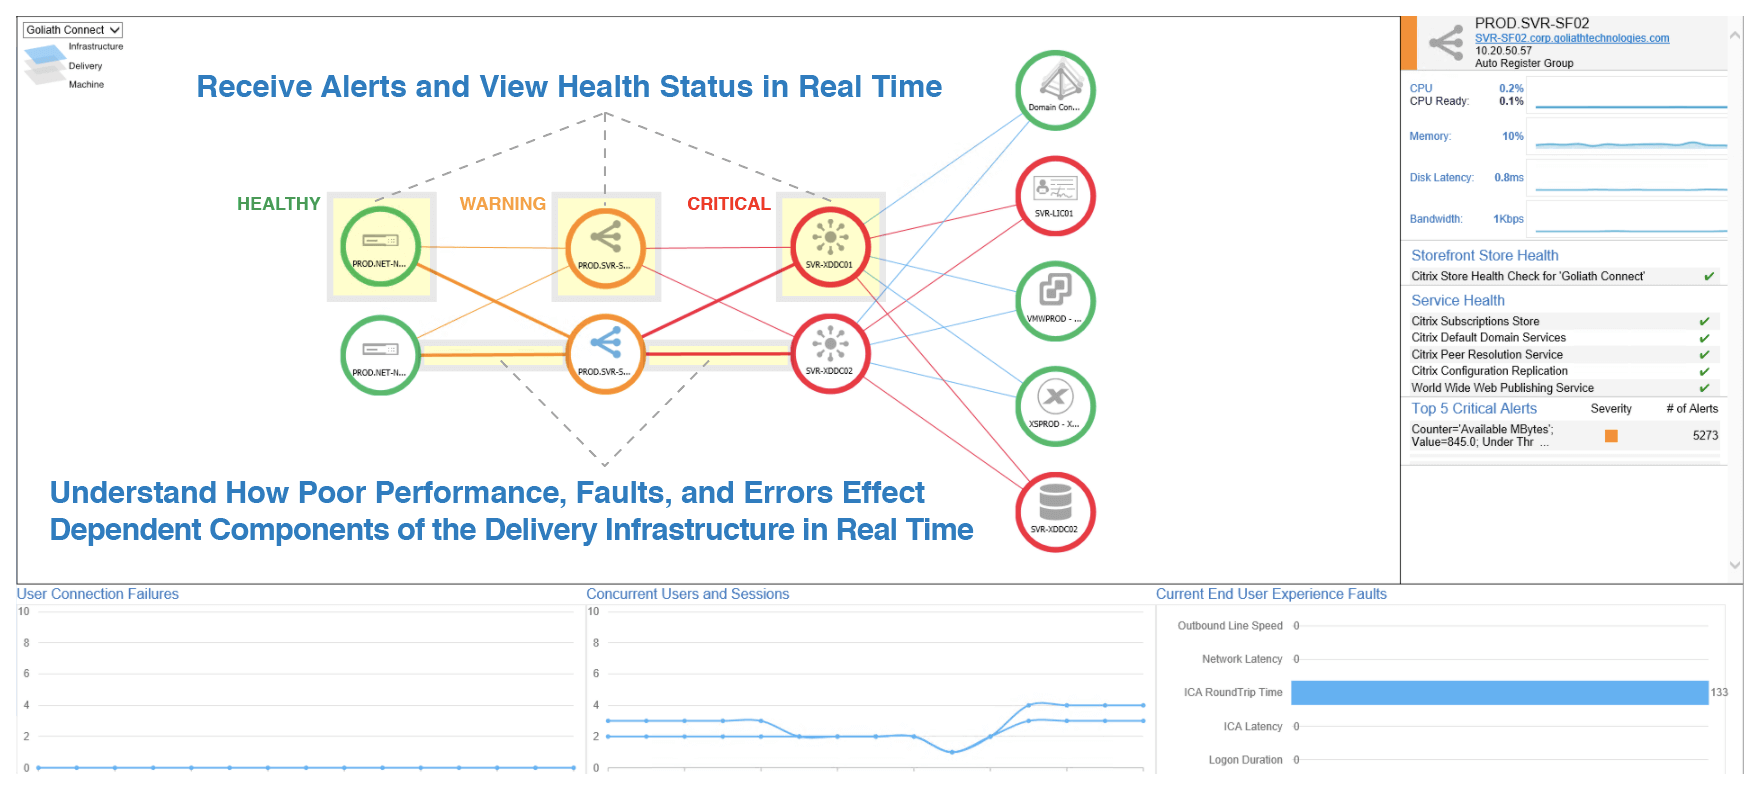
In the same screen as seen below, health status is represented by a color circle surrounding the specific component. As alerts are triggered, the color will change accordingly. Green represents a healthy status, orange represents warning level, and red represents a critical level fault. If the relationship status between components is impacted by a fault or error, the connection color is also changed to red or orange accordingly. The following image depicts the health status indicators.
Important Note
Dependencies including Active Directory, Microsoft SQL and the Virtual Infrastructure are auto mapped to the infrastructure view as depicted below. The health of these components, and how they impact other dependent services is dynamically presented in the display. Health statistics and details for each are also presented in the right pane.
Auto-Scaling allows for the entire infrastructure to be viewed and analyzed regardless of the size or scale of the environment, as shown below.
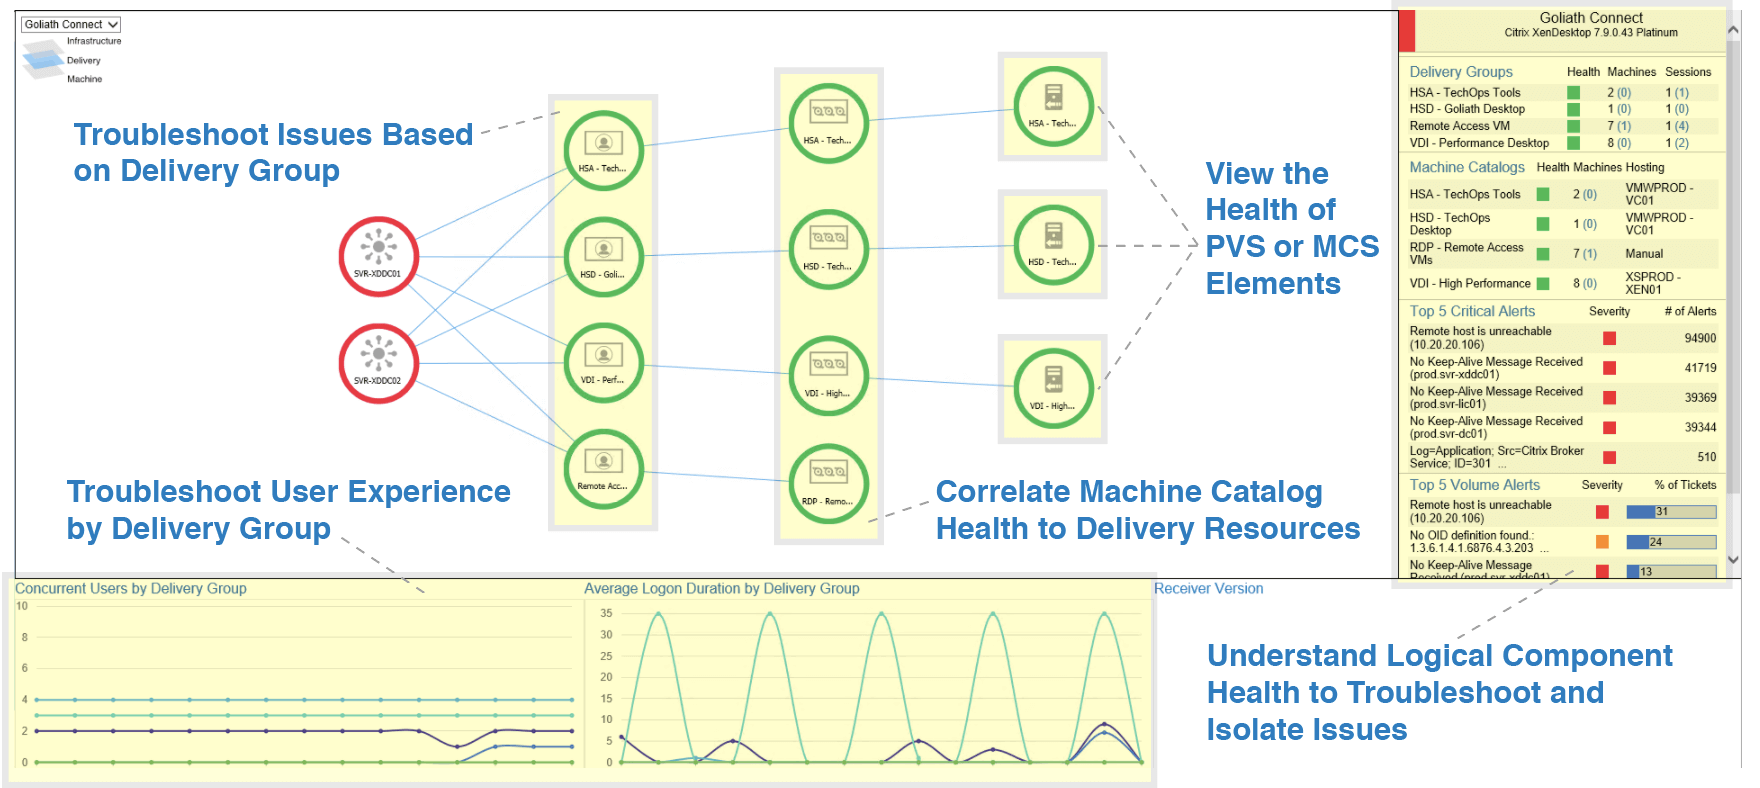
Delivery View
As we troubleshoot into to the second layer from the drilldown icon at the top left, the delivery view is displayed. As shown below, the site delivery controllers and all the logical components associated with application delivery are presented here.
Like the top layer, each component of the delivery view is surrounded by a circle. The color of the circle (green, orange or red) represents the health of the specific component. Connections between the components are displayed and color coded based on health status. The colored line provides an understanding of how the health of one component impacts another. Relevant health related information is displayed on the right pane based on the selected service. The user experience data displayed in the bottom charts is more specific and segmented based on delivery group.
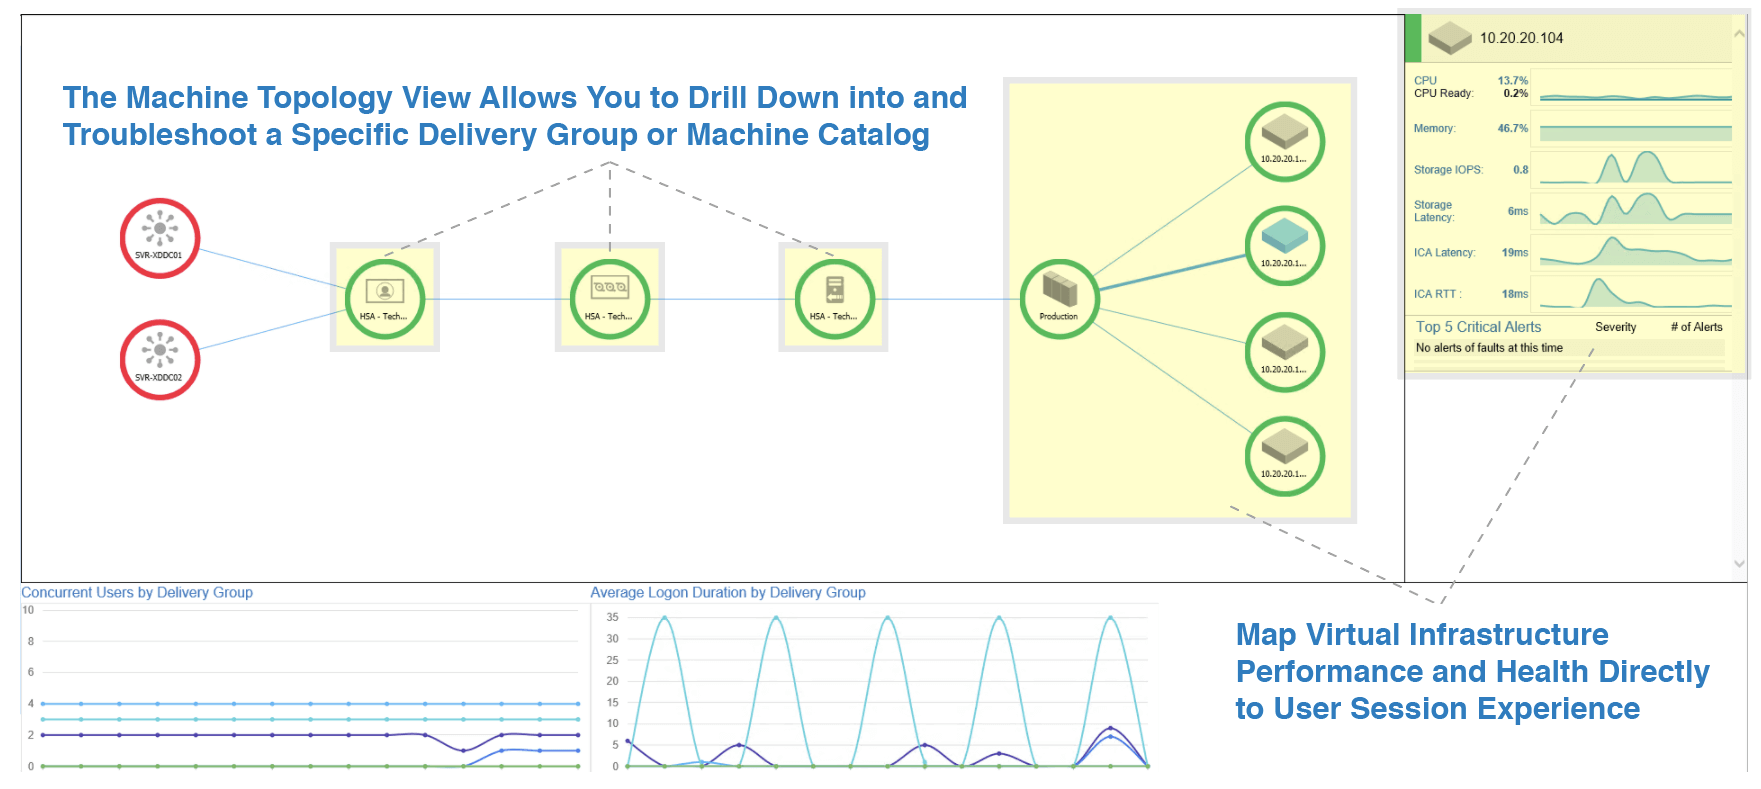
Machine View
Clicking either a delivery group or machine catalog from within the delivery view drills down to the machine topology view as depicted below. The Machine topology view extends the delivery group view out to the virtual cluster and host(s). This provides insight into the health of the cluster as well as the individual host servers, allowing you to trace host level issues directly through to delivery resources and subsequently the user’s session.
Summary
The Goliath Topology View for Citrix Monitoring and Citrix troubleshooting is designed to provide a complete multi-level overview of your entire Citrix delivery infrastructure. It is configured automatically and does not require user interaction to manually build the topology. Beyond providing a high-level overview of the architecture, the Topology View is fully interactive and operational, allowing you to see resource consumption, errors and faults in real-time. It also provides visibility into how specific service level issues directly impact individual components, their relationships to one another, and ultimately end-user-experience.